Monday, 22 June 2020

Plotting for Scientific and Engineering Applications Using Python


In learning anything to do with programming it often helps to have a motivating factor to invest time and effort into developing a particular programming application.

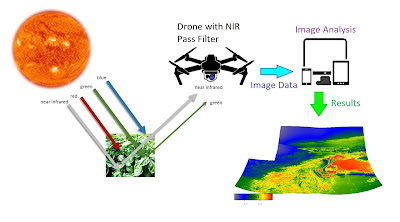
I have long found Python to be a very valuable tool with regard to spectrum analysis and image processing in developing remote sensing technology using modified drone cameras equipped with customised filters.

The science of acquiring images which contain information, such as near-infrared imagery, involves the development and testing of specialised optical filter technology for use in modified cameras for imaging.

The 2 filters developed for this purpose are essentially dual bandpass filters, made of high quality glass, with different transmission characteristics in the near-UV to blue band and Near-infrared band.

They are circular filters embedded in a custom housing for use with the Mavic 2 Pro Hasselblad Camera.

Filter#1


Filter#2


Measuring the spectra of the optical filters is critical for defining their application in the field.

We can measure the characteristic spectra using a visible wavelength optical spectrum analyser (OSA) and read the data into a plot in Python showing the dual-bandpass nature of the filter at 2 critical wavelength regions. 


We can overlay 2 sets of data from 2 filters and compare the 2 in the same wavelength regions


Both Types of Filters for sale here:

https://www.ebay.ie/itm/155859816325

https://www.ebay.ie/itm/155859834544


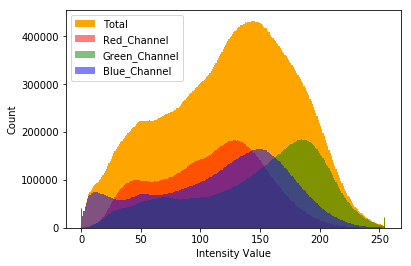
We can also study the color histogram of the image taken by comparing an image taken without a filter and and image taken using the different filter types.

With No Filter:


With Filter #2:


This information is useful in constructing radiation indices for identification of quantifiable objects in an image, which is key in the practice of quantity surveying using remote sensing techniques.

As we can see using the filter the green channel is greatly diminished and we can leverage the amount of Red detected (which is NIR using our filter) with the Blue using our formula to get the modified NDVI, giving a way to quantify the vegetation density in a photographed and/or mapped region. 


We can also plot the Red channel (Our NIR) vs the Blue Channel (Our Visible Leverage) to get a characteristic soil and wet edge profile, a kind of correlogram, which is very useful as a remote classification tool. 


The data in the scatter plot has a particular pattern however it is really too dense to properly interpret. A solution to this is to create a hexagon bin plot. 


we can tidy up our plotting further by using the gaussian kernal density function. This also helps prepare the plot for further study as we shall see.

To begin we need to flatten the data from a 2D pixel array to 1D with length corresponding to elements (Warning! this can take some time). the fastest way to do this is to use the python library-level function ravel, which reshapes the array and returns its view. Ravel will often be many times faster than the similar function flatten as no computer memory needs to be copied and the original array is not affected. *

With added shading we get an easier graph to view and work with overall:


With the ability to place a contour around certain regions of the plot we can then have the ability to link the spectral content with the spacial content in our image analysis.

First we can define a threshold for our NDVI and plot it to see the NDVI levels marked above this threshold if we wish


Next we can place a contour over the spectral region that the threshold mark corresponds to in the NIR vs Blue spectral graph.


We can interpret this ourselves and classify the spectral analysis using established knowledge of its features. This is the beginning of developing a kind of classification system based on this linked information.

We can also classify using other means such as plotting the pixels located between the dry and wet wedges to indicated where mixed vegetation could be.

Going futher down this path leads to exploring other tools such as clustering algorithms, support vector machines, neural networks and the like as we approach the cusp of the field of machine learning with our spectral information which is a valuable technology in and of itself. This deserves its own series of articles with regard to combining drone-based  remote sensing with machine vision tools, particularly some of those features in use in the QGIS toolboxes, such as Orfeo.

Interesting still is the fact that indices beyond the NDVI can be developed and studied using these scientific plotting techniques using new filter designs to explore new potential environmental markers. An Ultraviolet-based environmental index using UV-remote sensing cameras is already under development for use in land and marine applications, taking advantage of the ability of UV light to penetrate the air-water barrier and return useful reflectance image information which we will be exploring in the near future. 


As always the code is available on the GitHub page and is open for customisation and tinkering for each persons own needs: https://github.com/MuonRay/PythonScientificPlotting


Notes:

* see reference to this at pages 42-43 @ Numerical Python: A Practical Techniques Approach for Industry By Robert Johansson

Saturday, 13 June 2020

Drone NDVI Mapping with QGIS and Python Analysis Code


Code Link: https://github.com/MuonRay/QGISPython/blob/master/NDVIQGISWithMapLegend.py

In this video I showcase the creation and use of Near-Infrared (NIR) TIF orthomosaic datasets made using UAV (drone) photography and photogrammetry which can be analysed in QGIS using a Normalised Differential Vegetation Index (NDVI) processing in the Python console in QGIS. This is comparable to the analysis done using satellite imagery, such as Sentinel-2, however using a 4K NIR converted camera on a drone flying at a maximum height of 70 meters means that we can get up to 1cm pixel resolution on the ground, allowing for very accurate remote sensing of areas of interest.

QGIS itself a free geomatics software package with a lot of functionality with regards to creating custom code recipes for analysis of datasets acquired using Earth-monitoring satellites and/or drones. There are a lot of interesting add-ons for QGIS, going from simple codes that allow for a cursory editing of a dataset to improve contrast or in more complex applications such as the Orfeo toolbox for machine learning. QGIS, being opensource means that there is large online community of professionals who use its features in research and industry alike and regularly update the different applications of this impressive piece of software.

Scripts that run in QGIS are written in Python code with a particular syntax native to QGIS that allows it to call its image processing libraries, which work on TIFs with greater ease than Python standalone scripts alone would and do not create lossy conversions as experienced with Python standalone coding libraries when processing TIF data. There is also options to save the processed images with a defined dpi ratio to preserve the image quality when saving to PNG or JPEG files for viewing completed maps outside of the program.

I would highly recommend using QGIS in conjunction with drone imaging and I am eager to explore some of the more in-depth of its applications further, in particular with respect to the classification and potential of the Orfeo machine learning toolbox.

Tuesday, 9 June 2020

Fusing 3D Modelling with NDVI in Python + VisualSFM + Meshlab


Here is an exercise in 3D image processing I performed using Near-infrared images processed into colormap NDVI, allowing me to create a 3D model of plants for use in 3D plant monitoring/health classification.

Near-infrared (NIR) reflectance images as described before can carry information about the health of plants, with healthy plant tissue reflecting more strongly in NIR as well as Green.


The NDVI formula leverages the NIR channel with the visibly reflected light, in an NIR converted camera the Red channel becomes NIR and Blue and Green become the visible. The dual-bandpass filter chosen will separate the different color channels, in the case of the filter I use a separation between the blue and NIR regions of the spectrum.Thus In my Python code used to generate the NDVI, the blue channel is leveraged against NIR for more precise close range NDVI.


This was created using (1) custom Python code to process the NIR reflectance images into a graded NDVI temperature scale images and using a combination of (2) VisualSFM for point cloud and polygon generation and (3) Meshlab to tidy up and display the polygon file.


An RGB reconstruction was also performed on a collection of standard images (captured using a phone camera) of the collection of plants scanned for comparison.

The NDVI 3D model was not a perfect reconstruction however it was cleaner in general than the RGB model and considerably faster to process in VisualSFM after the Python code had processed the input RAW (DNG format) images. It is relatively easy to see the distinction between the healthy vegetation and the background environment, the wooden decking, the plants were placed upon in the NDVI 3D model. This has lead me to think that this technique could be further developed in machine vision of plants in an environment in 3D, especially if the 3D model can be converted into a movie using a program like CMPMVS which could then be plugged into a platform such as PyTorch or Tensorflow for use in plant health classification in 3D.In any case this was an interesting way to demonstrate the use of NDVI and NIR imaging as applied in novel applications in the field of 3D photogrammetry and modelling with the intent of creating datasets for future explorations in machine vision research.Code Available Here: https://github.com/MuonRay/PythonNDVI/blob/master/ndvibatch.py


Wednesday, 27 May 2020

Generating NDVI Drone Panoramas in Python Code


 I share the development of a project that uses near infrared drone imaging to create NDVI panorama mosaics in Python with all coding available on the GitHub Repository here:
https://github.com/MuonRay/PythonNDVI/blob/master/PanoramaNDVIRawInput.py

Panorama Stitching, as used in aerial/satellite imaging and space exploration, uses a point matching algorithm (i.e. SIFT) on images taken from a camera then applies a homography transform creating a mosaic composite image. 

Here Using a 4K NIR Drone Camera we can create HDR NDVI Panoramas using DNG files for input (a JPEG Version is also available).  


We have talked about NDVI and how to generate standalone NDVI Drone images in previous articles such as here: http://muonray.blogspot.com/2019/07/ndvi-vegetation-mapping-project-with.html and here: http://muonray.blogspot.com/2019/10/specialist-ndvi-filter-developments-for.html

DNG is the RAW Format used in DJI's Mavic 2 Pro drone and is a data rich file format that requires Python's rawpy library to decode into a form that can be worked with using OpenCV for general image editing generally and panorama stitching specifically in Python.

It is hoped that this coding project will be a less computing intense solution to generating NDVI diagnostics of the environment without the need for expensive or computationally intensive processing such as creating 3D orthomosaics or photogrammetry files which can be relatively more daunting to produce and work with as compared to a panorama. 


Essentially any images acquired using a Near-Infrared (NIR) converted camera can be used to generate a modified Normalized Differential Vegetation Index (NDVI). The coding contains standalone colorbar legend and is a batch processing version that works with all DNG files in the working directory. ENDVI and SAVI Indexes also available and with greyscale options. in the larger Python NDVI GitHub project folder. I also encourage open modification and tinkering of this projects code for improving this field of exploration and environmental examination.


I have also included a selection of custom developed python codes for use in various drone imaging applications, such as batch conversion of DNG (RAW) drone images to JPEG or PNG, use of the rawpy library features of demosaicing, gamma factor correction and use of skimage library to demonstrate histogram equalization in colour images to create better contrast and depth. This repository also increases coding developed for use in generating panorama composite images both in JPG and DNG format, a very useful technique in high definition aerial imagery. These codes are open for use in educational and demonstration uses and for non-profit organisations.

See here:https://github.com/MuonRay/Drone-Image-Editing-in-Python-Coding-Repository

Wednesday, 29 April 2020

Using Adobe Bridge with Camera Raw for Drone Panorama Editing Applications


Here is a short video showing how I use Camera Raw in Adobe Bridge to generate Drone Panorama images quickly and easily with or without opening Photoshop. The advantages processing in Adobe Bridge offers is that it can improve the speed and efficiency of stitching together large images in panorama without slowing down your computer significantly.

Photoshop, like all programs, uses up some of your computer's resources while it's open. Even if you're not working in Photoshop at the time, as long as it's open in the background, it's still using up resources. If you're working on a slower computer to begin with, having programs open in the background that you're not using can slow you down even more.

Camera Raw offers such a complete image editing environment that it's entirely possible to do everything you need to do with your photo in Camera Raw without ever needing to open it in Photoshop for further editing, including cropping, aligning, contrast and color channel editing. Camera Raw is perfectly capable of running in Bridge itself, or another way to put it, Camera Raw can be "hosted" by Bridge, just like it can be hosted by Photoshop.

Another benefit to running Camera Raw from Bridge, and one that has an impact on your workflow, is that when you're finished processing one image in Camera Raw and click the Done button to close out of it, you're instantly returned to Bridge, ready to select and open the next image or sets of images for further processing.


Thursday, 26 March 2020

Coronavirus Emergency In Ireland - Why The Government Must Mandate a 2 Week Total Shutdown


This is an urgent message, so lets not waste time with introductions.

The Government of Ireland must mandate a Complete Shutdown of all non-essential and non-medical business immediately. 

This means closing all non-essential manufacturing, factories, construction sites, call centers and non-essential warehouse work (excepting medical device, food services for humans and animals, pharmaceuticals and other essentials) - Private and Multinational firms that are still continuing business as usual in Ireland MUST BE CLOSED - They must not be allowed to continue work as they dictate until they chose to close. WE ARE IN A NATIONAL CRISIS AND THEY MUST BE MANDATED TO CLOSE. 

I RECOMMEND THAT AS MANY PEOPLE AS POSSIBLE USE THIS POST AS A PLATFORM TO NAME AND SHAME PRIVATE COMPANIES IN THE REPUBLIC OF IRELAND THAT ARE REFUSING TO CLOSE AND PUTTING THE LIVES OF OUR CITIZENRY AT RISK AND ARE MORTGAGING THE FUTURE OF LIFE AS WE KNOW IT FOR SHORT-TERM PROFIT.

The numbers of people out on the streets, parks, beaches and other public environs is also alarming. In the UK it is now illegal to be out during a nationwide lockdown while in Ireland we have still not made measures to ENFORCE SOCIAL DISTANCING THAT CAN SAVE HUNDREDS IF NOT THOUSANDS OF LIVES. 


Despite many euphemisms and mitigating measures the government has taken they have been half-measures at best and will do nothing to FLATTEN THE INFECTION CURVE. WE MUST MOVE PAST HALF-ASSED MITIGATION AND HAVE A FULL LOCKDOWN, APPLY "THE HAMMER" - Only then can we move onto "THE DANCE" AND CAREFULLY RESTART OUR COUNTRY AGAIN.

The key word here is MITIGATING MEASURES. the government refuse to take any hardline measures to, in-effect, flatted the infection from an exponential rate to a linear rate and eventually reaching a level that will not overwhelm our already beleaguered healthcare system. 


We have healthcare workers who can only be considered superheroes at this point who are quickly becoming so overwhelmed that they are, in-effect, samurai in nurses and doctors clothing. They are risking their own lives and also having to take the extra burden and risk because, again PRIVATE BUSINESSES REFUSE TO CLOSE ON THEIR OWN! THEY MUST BE FORCED RIGHT NOW!

TIME IS KEY IN ALL OF THIS. WE MUST GET OUR COUNTRY FROM AN EXPONENTIAL STAGE OF INFECTION RATE TO A LINEAR STAGE AND FLATTEN THE CURVE. WE CAN ONLY DO THIS WITH A FULL LOCKDOWN FOR AT LEAST 2 WEEKS!

To citizens I recommend you STAY INDOORS AS LONG AS POSSIBLE, we can only fight this virus and stop it becoming a permanent part of the microbial ecosystem in this country if we band together on this and most importantly HOLD BUSINESS AND GOVERNMENT TO ACCOUNT! DON'T FORGET THAT THEY SHOULD HAVE HAD A WUHAN OR RUSSIAN STYLE LOCKDOWN AT LEAST A WEEK AGO IF NOT TWO!

THE DATA DOES NOT LIE - The John's Hopkins Website has been providing more up to date information than any of the highly funded and subsidized quangos and institutions in IRELAND. The most important detail is to read the shape of the graph, not merely quote numbers.

This is Our Status (March 26th 2020):


WE ARE HEADING INTO EXPONENTIAL GROWTH. WE MUST ACT NOW!

Compare this to Italy, the Worst Country Hit in Europe:


EXPONENTIAL INFECTION RATE HAS CAUSED THE VAST NUMBER OF DEATHS WITHIN ITALY.

SEE John's Hopkins COVID 19 Updates live here: reading the curve is far more essential than the individual numbers: https://coronavirus.jhu.edu/map.html

The Ideal is to APPLY THE HAMMER, initiate a 2 week controlled lockdown and flatten the infection rate, as CHINA and most East Asian Countries have done:


WE HAVE BEEN TOLD CONSTANTLY BY THE IRISH GOVERNMENT AND THE MAINSTREAM MEDIA (RTE Are most culpable) THAT THE WORD "LOCKDOWN" IS A SCARE TACTIC. WELL, IN TIMES LIKE THIS FEAR WORKS TO GET THE JOB DONE. WE DON'T HAVE TO BE AFRAID FOREVER BUT THIS CRISIS REQUIRES US TO REALLY BE AFRAID FOR OUR LOVED ONES AND FOR OURSELVES.

Morever, it has not been the word "lockdown" that the citizenry have had a hard time understanding: The term "Social distancing" has been apparently interpreted by the public with a mixture of confusion and reckless abandon, maybe because it was written by the same second-rate advertising gurus that write the script our politicians read. 

As the Comedian George Carlin once said "Euphemisms are bullshit, people need direct honest language" - So, my fellows, please STAY INDOORS FOR AS LONG AS YOU HAVE FOOD AND MEDICINE! 


Again, to the Government, INITIATE A CLOSURE OF NON-ESSENTIAL PRIVATE BUSINESSES TO ENSURE THAT WE FLATTEN THE INFECTION RATE! YOU WILL BE HELD ACCOUNT FOR THIS NEGLIGENCE!

We can hopefully look back on this moment and perhaps laugh and have a kind of "I was there" moment with the kids in the future. Perhaps. But if we do not act now we are going to plunge this country into loss and sorrow that will take generations to heal. Please do what is in the common good.

IMPORTANT NOTE:

As I write this America has overtaken every other country as the most heavily infected. this was not unexpected given the delayed response there however they are due to get much worse due to the high level of exponential growth leading to a great strain on their healthcare system:


Saturday, 14 March 2020

Framing The Power of Art Using Luminescent Solar Concentrators and UV Lighting


This project involves creating vibrant etching artwork using ultraviolet reactive perspex in a Luminescent Solar Concentrator (LSC) configuration with silicon thin film solar panels on the side to harvest light as energy, boosted using an energy harvester circuit designed for indoor solar energy harvesting.

This technology was developed over a few years and has been tested using many different designs. The concept of using solar concentrators in buildings (in windows, roofing, glasshouses etc) has been explored in many research scenarios however the development of indoor based light-energy harvesting for display use is something that is novel in the context of use in displaying artwork.

UV artwork is very interesting and the vibrancy in certain UV reactive materials adds a contrast on images within the environment they are placed that is not found in other display media. The UV light source does not need to be super-bright and often the display is more effective in an environment where lighting is kept at a minimum to bring out the sharper colors from the fluorescence.  Many museums are using this technique to create interesting and eye catching displays for unique visual experiences. In some situations it resembles Neon lighting however it is far more energy efficient and safer to install.


Introduction:


The installation of conventional photovoltaic (PV) solar cells have many advantages. The ease of installation, the ability to generate energy locally and with minimal investment and supervision makes them ideal to install on buildings and integrate within devices.They can be used on rooftops, most portable solar chargers and in other applications directly absorb sunlight and convert it into electricity. 

The major drawback is that amount of power, in watts, conventional solar cells can harvest is dependent on the amount of area the cells cover. So in areas where surface area is a premium, PV solar has clear limits in its energy harvesting capacity. High rise cities for example do not have the space for all but the most superficial of solar energy installations. This is a fundamental problem for genuinely running an energy hungry city on energy harvested directly from the environment.

Electricity is generally consumed first at the source where it is generated. So energy producing installations if positioned far from a cityscape will have their transmitted power drawn from other sources first, such as small towns and villages, and ultimately creates a situation where prioritization of power distribution is backwards - effectively powering the small municipalities before the larger ones.

Accounting for losses in transmission over large distances also means it makes sense to position a power plant as close to a city as possible. This is not so much a problem with stored fuels, such as fossil fuels, which can be stored and converted to electricity in power stations that require less space and are thus possible to install near large cities. With generic renewable energy however, large amounts of space is required, be it wind farms or solar arrays, so it is not really practical to position it near a city for the reason described and certainly not within it, only in a superficial sense such as on rooftops, as city high rises inevitable lead to shading of the surface. 

Conventional PV solar cells made of high quality materials, from Silicon to CIGS, will require refinement, purification, cleaning, doping and deposition and this will naturally increase their expense as the power they are expected to generate, and thus size, increases in demand. So even with conventional photo-voltaic solar cells we are trapped in the process in which the more power we want to harvest, the more money we will have to invest, making the transition to solar energy an expensive one.

This does not even go into mentioning that the most efficient photovoltaic absorption materials known, such as Gallium Arsenide (which has benefits of being a radiation-hard material) and  perovskite photovoltaic materials are extremely expensive.


Concentrating and Harvesting Solar Energy


Methods of concentrating solar energy, such as using reflective mirrors and/or lenses offers an obvious solution to the problem. However concentrating solar energy using conventional methods often means that we must have more supervision and infrastructure available in an area. For example, concentrating solar energy by mirrors and/or lenses is often done by heating water in a power plant infrastructure which may not always be available in a local area and will require yet more investment. 

Moreover, different technologies are required to harvest the concentrated solar energy - i.e. using Stirling engines, thus creating technology barriers along with the economic cost on transitioning to solar energy.

Therefore it would be nice if we were able to use combine the ability to harvest solar energy using conventional solar cells with new approaches to concentrating solar energy. One such approach is the idea to concentrate the solar energy by "pumping" a fluorescent medium with sunlight, akin to how a laser crystal can be pumped with a flashlamp, in which by clever design of the fluorescent medium and optics, the photon population in the flourescnt medium can be concentrated to a large level which can then be delivered to the PV cell.

This is the idea behind the operation of a Luminscent Solar Concentrators or LSC. A LSC absorbs the light on a plate embedded with highly efficient light-emitters called “lumophores” that then re-emit the absorbed light at longer wavelengths, a process known as the Stokes shift. For example, absorbing UV radiation to produce visible light. This re-emitted light is directed by total internal reflection (just like an optical fiber) to a micro-solar cell for conversion to electricity. Because the plate is much larger than the micro-solar cell, the solar energy hitting the cell is highly concentrated.


With a sufficient concentration factor, only small amounts of expensive photovoltaic materials are needed to collect light from a potentially inexpensive luminescent waveguide. The waveguides could be in principle made to be integrated into double-glazed glass windows, thus providing a possible solution to the integration of energy harvesting within high rise cities and across all available dimensions of a building.

Even within a building, in locations where sunlight reaches on walls the concentration of light to generate moderate amounts of energy can be achieved, at the very least for lighting.

Now why would this be important to consider? Well, LSCs have not only the potential to provide a means to Stokes-shift shorter wavelengths, such as UV, into longer ones such as red and blue, but also to provide a means to upconvert longer wavelengths of light, such as infrared, which is not converted to electricity by the PV material into shorter wavelengths such as red.

A large portion of radiation emitted by the Sun itself is in infrared and only generates waste heat in a PV cell, which undermines its overall performance. So developing materials that do demonstrate upconversion of infrared light, from IR lasers, is a reasonable step to developing devices that will work outside of the lab, perhaps using sunlight or alternatively as a way to provide wireless power distribution by means of lasers. Energy distribution by means of lasers, such as the common GaN UV Lasers, may also be possible to demonstrate with such a system..


This project, its images and design was developed by MuonRay Enterprises Ireland for educational purposes.


Artworks Depicted


In this project I created several etchings as a demonstration of how etching UV Perspex on different layers with contrasting colors can create very vivid and sharply colored images, not to mention the inclusion of a mirror which gives the images a sort of "floating pseudo-hologram effect". I will share the images depicted in the video and explain what they are from. All are cultural and historical symbols that I find interesting.


A mythical dragon, somewhat inspired by oriental dragons but I was thinking more along the lines of Lewis Carroll's Jabberwock when I was designing it - "with eyes of flame!"

The Winged Disk - The winged sun is a symbol associated with divinity, royalty and power in the Ancient Near East in particular the Old Kingdom of Ancient Egypt where it was used both to represent the Gods Ra and Horus.


A Celtic Knot Moon in conjunction with a Celtic Spiral Sun. The Celtic Knot is sometimes a depiction of a universe forever in flux but without clear beginning or end either in scale or direction. The Spiral Trigram is commonly associated with the connection between the changing seasons, death, life and rebirth. All are a common motif in Ancient Irish Culture.


The 4 Treasures of the Tuatha Dé Danann, a supernatural magical race in Irish mythology who bore these magical artifacts, crafted in faraway islands beyond Ireland. They are thought to be a pantheon of demigods or precursors to the main deities of pre-Christian Gaelic Ireland. In my depiction of the 4 Treasures, I symbolise each with one of the 4 classical elements of antiquity.

Claíomh Solais (The Sword of Light) - A Magical Sword that when swung no person could escape it. This sword is often associated with Nuada the King of the Tuatha Dé Danann, with him sometimes given the epithet Airgeadlámh, meaning "silver hand/arm". The element I have associated it with is fire.


Cauldron of Dagda - Dagda was one of the Tuatha De Dannan and later on the Irish All Father associated with fertility, agriculture, strength, as well as magic, druidry and wisdom. He is strongly associated with the culture at the Brú na Bóinne (Newgrange). From His cauldron it is said nourishment flows from which nobody is ever left hungry or weak. The element I have associated it with is water.

Lia Fáil (Stone of Destiny) - This is the ancient Coronation stone from which the High King's and Queens of Ireland would be deemed fit to rule the country by the stone itself vibrating. The an ancient stone still sits on the Hill of Tara to this day, however whether or not this is the true one remains unknown. The element I have depicted with this treasure is Earth with plant like roots boring into the ground from the stone to add to the effect and also the name of the stone itself etched in Ogham.

The Spear of Lugh - Lugh is a God of many talents in Irish mythology. He was a master craftsman but also a warrior and in some depictions both a messenger and a trickster. Lugh is linked with the harvest festival of Lughnasadh, which bears his name. He was also attributed to storms and so I have depicted his weapon of choice, a spear, with lighting and attribute it as the element of air. When Lugh uses his spear, it is said that it brings a decisive end to all conflict. 


This symbol is the Hamsa Hand, also known as The Hand of Miriam (Sister of Moses) in Jewish Tradition and also known as The Hand of Fatima in Islam and to a less common extent as the Hand of Mary in Christianity. There is also history of its use much earlier in Ancient India. In general it is used as a protective talisman. It is a symbol that people believe can protect them from harm against the evil eye and bring them goodness, abundance, fertility, luck and good health. In my travels I have seen it quite commonly used on ships in the Middle East as a charm to ward off storms.

With this one I used 3 layers of UV reactive perspex to reasonable effect at creating a vibrant display of color.


This project has been a fun way to share the concept of using perspex to create efficient illuminated artwork that can power itself and remain functional without external power sources. The technique in developing the art has been a learning experience for me and I hope to create more artwork using this technique in the future. 


Thursday, 20 February 2020

3D NIR Drone Scanning: Python + VisualSFM VS PIX4D


In this project I showcase my developments in 3D Drone Scanning where I can generate detailed 3D models with NDVI indices by modifying the DJI Mavic 2 Pro Hasselblad Camera in a Near-Infrared (NIR) Conversion.

Using a custom made Dual Bandpass Filter I can obtain clear NIR, green and blue leveraged colour images  which can be processed in Python + Visual SFM for free (using Code I developed in Python) and viewed in Meshlab. The advantage of this technique is affordability.

Alternatively, using commercial software such as PIX4D I can use the reflectance maps to generate a high fedelity and clear NDVI, ENDVI, SAVI map with customisable colormaps which look professional and can be used in the PIX4D BIM suite for accurate volume and area measurements which can be a very useful tool for systemic analysis of a region. In my view PIX4D offers unequaled scope in what one can do with drone mapping.


Index based classification is itself a forerunner to more sophisticated techniques in the field of machine learning. Machine learning is a diverse tool that uses convolution neural networks, trained under either supervised or non-supervised conditions with a selection of classified data for classifying known objects in a general landscape. This can allow, among other things, the user to compare directly individual sections of a chosen landscape, i.e. which areas have been depleted of vegetation with respect to others and what consistently known features are associated with this difference, i.e. the presence or absence of a significant plant undergrowth/understory/underbrush.


With 2D data alone however such classifications are impoverished from significant environmental features, the most important one being missing is overall topology of the landscape. We simply can only see and classify so much from a single 2D point of view, even with tools such as NDVI and others. No matter how many detectors may be onboard an imaging system, be it drone or satellite, without noticing this fact we are limiting our scope of classification.


Topology data of a landscape is itself critical for numerous reasons, being the source information for depth-based classifications, the basis for performing dynamic partial differential flow-based simulations (in fire physics, air flow, etc.) and even for charting the individual biomes in a region with elevation being a key factor affecting the distribution of species in an area, cold-thriving species existing upland and temperate species existing closer to sea level for example.


3D Scanning is the obvious solution and can be accomplished just as easily with NIR cameras as with regular imaging systems onboard a drone. The only difference being the ability to process the large datasets needed into meaningful maps that can have their features classified by the conventional tools of NDVI, ENDVI, SAVI and so on.


Using apps such as DroneHarmony or DJI Mapping Software with the Phantom 4 RTK for example it is possible to plan a plot sweep of a region of defined size.


The convential RGB data is itself very useful and can be classified with meaningful results based on height, shape and colour. This all epends on the 3D reconstructing software being used. PIX4D Mapper is probably the best proprietary software soltion on the market today for this work. The ease of processing and the countless features of this software really makes it the industry standard in construction, mining and of course for environmental monitoring.


The output is a orthomosaic TIFF file which can be classified using NDVI, ENDVI, SAVI as has been done before.


Creating full 3d NDVI Maps using freeware is a bit trickier but can be done in practice aswell. One must be careful not to delete the EXIF Data in Post-processing, or if one does then it is advise that data be transferred over to allow for consitency in maps to compare between RGB and NDVI profiles.

This can be done in Matlab or Python, depending on preference.


This project is attempted with existing freeware for ease of reproduction and replication. Python, Meshlab and VisualSFM and CMVS are all free and opensource. This is of utmost importance for NGOs and Charities working in this area.

Another useful program is QGIS which is opensource and works with Python in its interface and can run scripts from a built in compiler. At the very least it is useful for converting the orthomosaic TIFF Files in JPEG images which retain geoinformation. This is useful for doing postprocessing in Python.

The full unabridged use of QGIS in its full potential in NDVI-style classification is a subject for another project however and I hope to come back to sharing my experiences of using it in the near future. 

Sunday, 22 December 2019

NIR Drone Scanning of Ancient Megalithic Cairn Tombs at Loughcrew County...


This video shows some test footage of the megalithic passage cairn tombs at Loughcrew in County Meath, Republic of Ireland this Winter Solstice taken with an NIR converted Hasselblad camera onboard the DJI Mavic Pro 2 drone.

Clusters of Megalithic Cairns are dotted around the Slieve na Caillaigh hills at Loughcrew, the main concentrations are on Carnbane East where Cairn T is the centrepiece and Carnbane West where Cairn L is located.
The illumination of the passage and chamber at the Winter solstice sunrise in Newgrange is world famous. Less well known is the Equinox illumination at sunrise in Cairn T at Loughcrew. The backstone of the chamber is illuminated by a beam of light at sunrise on the Spring and Autumnal Equinoxes.

The sun light is shaped by the stones of the entrance and passage and descends the backstone while moving from left to the right illuminating the solar symbols.

With Drone-based NIR Imaging, combined with the Soil-Adjusted Vegetation Index (SAVI) it is possible to map certain artificial features in the topography of the land with respect to the vegetation distribution. This allows for the possibility to examine the scale of manmade features such as farmland, burial sites and perhaps settlements that have been buried for centuries and can be difficult to detect using visual maps alone.

The SAVI index is one of many indices used by archaeologists in such research and drone-based imaging offers a unique opportunity to test such techniques affordably and quickly, without the use of more expensive aircraft or satellite imaging techniques. Moreover, the ease of deployment and the high quality of the imaging systems available for drones today makes them superior to other forms of often more expensive aerial surveillance, something which will become a major trend in the future as drone imaging and mapping advances.


Friday, 15 November 2019

Herschel and the Physics of the Invisible Universe


Most of the universe is invisible to humankind. Moreover most of it is currently invisible to our modern equipment. As advanced and fine-tuned as it is at present, all of our detectors in the enterprise of physics could only ever see about 4% of the universe, theoretically. The rest, 96%, is essentially an invisible section of reality, made up of Dark Matter and Dark Energy. These percentage distributions is also merely based on what we know now about the structure of galaxies and their expansion, there is every reason to think that there is even more hidden physics, perhaps on forever.

We sometimes take it for granted that a lot of physics is invisible to our eye and everyday experience, particularly when considering our modern technological world depends on the existence of countless invisible wireless signals.

However the existence of invisible packets of energy, acting at a distance, would have been a completely occult notion at the time of Newton and Huygens with their respective theories of light being made up of quantifiable corpuscles and waves respectfully, expanding upon the first treatment of light as being a system of rays as described by Fermat into being a composite structure to describe such phenomena as reflection, refraction and of course the visible spectrum as a function of interaction of white light with a prism.


Newton's Corpuscular (or particle) theory of light, is based on the view of light being made up of equally elastic particles, held sway for much of the 18th century as it could explain refraction and reflection relatively well up until the phenomenon of interference could not be explained using particles alone.

The development of classical optics as described mathematically by Huygens and then used by Fresnel in the Huygens-Fresnel wave theory of light is necessary, among other things, to explain in the observation that parallel if a beam of light shines on a small round object, a bright spot will appear at the center of a circular shadow by means of constructive interference of the waves travelling around the object. Further developments of course in the experiments of double slit produced interference by Thomas Young further confirmed the wave theory of light as being necessary.


In any event, the notion of "action a at a distance" when considering forces acting on particles of light or matter was deeply troubling to Newton and he consciously developed his theories to eliminate what he considered to be non-existent forces. Newton's laws are a their core an empirical approximation of physics*(#1) and in a sense continue on the work laid out by Galileo before him. Newton, using the calculus he invented, ran mathematical studies on how things moved over time, and found a small set of rules which could be used to predict what would happen to, say, frictionless balls being pushed from a state of rest and how inertial masses create equal and opposite motion. The laws "work" in effect because they are effective at predicting the visible universe, which was assumed by scientists of the 17th century to be analogous to a clock with a perfectly visible and quantifiable clockwork.

Newton and other contemporaries such as Huygens did not examine physical laws which were in a sense "invisible" - Newton himself could not explain the origin of gravity in his theory and in a way his physics was a bookkeeping device to in a sense replace its explanation with its function and thus make predictions of the thing without having to explain the thing itself. and objects beyond simply labels of F12 and M1, F21 and M2, so that F12 = -F21 for example:


Huygens also did not explain the origin of the waves in his wave theory of light, that needed much more work in the development of electromagnetism and it was not until nearly the end of the 19th century that the invisible forces of electricity and magnetism acting in unison gave rise to the nature of the waves of light itself, as described by James Clerk Maxwell.

Nevertheless, Newton's theories were and still are very successful in applications, however it must be said that they do lack explanatory power of the nature of the forces themselves. They are still, in effect, "invisible" in this arrangement*(#2)

The beginning of modern science to look into the physics of the truly "invisible" really began with the famous 18th to 19th century astronomer William Herschel.

Sir William Herschel
bust by John Charles Lochée
1787

William Herschel was born on November 15th, 1738 in Hanover Germany. Herschel performed his extensive scientific work in Britain, which he migrated to when he was 19 to avoid military service during the infamous Seven-Years-War. Living in Britain, the young Herschel had been able to earn a living as as a skilled musician and composer for 15 years, during which his sister Caroline Herschel joined in him Britain and became a skilled musician, mathematician and astronomer in her own right. Both the Herschel siblings' work in astronomy was remarkably thorough, dedicated and careful. However, we shall see that he was not so careful to avoid the spark of true discovery that can often lie hidden just orthogonal to established knowledge.

Beginning his work in astronomy, William Herschel constructed his primary Newtonian telescope in the back garden of his home in London. He had constructed his telescope with the specific missions to study binary star systems to observe, over many years with his sister Caroline, the proper motion of stars and this singular focus led to a plethora of discoveries along the way between his initial years of astronomical study between 1779 and 1792. He soon discovered many more binary and multiple stars than expected, and compiled them with careful measurements of their relative positions in two catalogs presented regularly to the Royal Society in London.

Artist's rendition of a binary star system


In 1797, Herschel measured many of the systems again, and discovered changes in their relative positions that could not be attributed to the parallax caused by the Earth's orbit.

He waited until 1802 to announce the hypothesis that the two stars might be "binary sidereal systems" orbiting under mutual gravitational attraction, a baricenter essentially around empty space, a hypothesis he confirmed in 1803.

Such a discovery was very phenomenal at the time, as Herschel himself had been influenced by the writings of his fellow astronomer John Mitchel, who in 1783 proposed the concept of "Dark Stars", essentially invisible stars so massive that light cannot escape. Mitchel was also supportive of the theory of binary systems of stars existing around mutual gravitational centers and perhaps influenced a connection between the two.


In between this work, while looking for binary star systems, Herschel systematically reexamined objects discovered previously by Charles Messier and cataloged (but largely unclassified) in his famous catalog on stars. Messier was focused on searching for comets and so, understandably, did not spend much time on the objects he had first classified in a system of numbers we still use today for most objects seen in the Northern skies, M31 for example; the Andromeda Galaxy.

Herschel discovered that many objects, seen initially as stars, in the Messier catalog were in fact clusters of stars or nebulae* but one object he found, which had not been found by Messier before and which turned out to be the Planet Uranus. This was a significant discovery, as it was the first planet discovered since ancient times, all planets up to Saturn having been known since at least the Ancient Greeks and most probably earlier. It also helps put to sleep the notion that there is some hidden geometric mysticism to the planetary arrangements to many people: after all, what astrologer or psychic ever had anything to say before about the 7th planet!


This discovery also set Herschel up with the opportunity to do astronomy, and by extension, physics in general, as a full time profession. Herschel, somewhat obsequiously, called the new planet the "Georgian star" (Georgium sidus) after King George III, which predictably brought him favor with the King; the name of the Planet did not stick, particularly internationally. In any event, the King of England offered William a constant stipend of 200 pounds a month, less than he could of earned as a full time musician according to records but a job that Herschel took immediately! Caroline herself was eventually to get 50 pounds per month as William's assistant, making her the first woman in recorded history to receive a salary as an astronomer.

William and Caroline, now both in the employ of King George III, were now able to conduct astronomy on a scale that saw the largest telescopes of their time being constructed, such as Herschel's famous 20 foot, 18.7'' telescope

Herschel's 20 Foot Telescope

It could be argued this began the age of large scale telescope construction. Progress in astronomy on the surface of the earth really is a matter of simply building larger individual telescopes (or baselines of multiple telescopes) in better locations and this is a fact right up to the present day.

During his career, Herschel was as renowned as a maker of telescopes as he was as an astronomer, and he oversaw the construction of several hundred instruments, which were sold in England, Ireland and in the European continent. Using even larger telescopes, such as 40 foot telescope built in 1789, William was able to catalog much more deep sky objects and created the first surveys of the Milky way and discovered that many of the deep sky objects were so-called "spiral nebulae", really galaxies although the notion of a galaxy was unknown to astronomers of that time.


Caroline was also given a telescope, constructed by William, similar to the one with which he had discovered Uranus. With this telescope Caroline discovered 8 comets and over a dozen “nebulae” between 1783 and 1797.

These included: Spiral Galaxy NGC 253 Elliptical Galaxy M110, one of the satellite galaxies to Andromeda and discovered many comets in her time too, being one of the first women to be recognized for such work at the Royal Society in London.

During the rest of his life, William Herschel produced lists of thousands of nebulae and star clusters, and he was the first to distinguish between distant clusters and dusty nebulae.


As large as some of the telescopes he designed, William Herschel was also working with smaller telescopes, this time to examine the spectrum of stars and of the Sun itself. Herschel started at first to use color filters to separate the different bands of visible light from astronomical objects, a technique still used in amateur astronomy today to highlight certain features.

A Color Filter that Exposes the Near-Infrared and Near-Ultraviolet from Sunlight

In his observations of the Sun, in February 1800, Herschel described how the various colored filters through which he observed the Sun allowed different levels of heat to pass. The energy output of a 5700–5800K star, our sun, is greater in the visible wavelengths than in the infra-red, and most of the visible light should be passing equally through the atmosphere. How could these redder wavelengths then be hotter?

He performed a simple experiment to study the 'heating powers of colored rays': Like Newton over a century before he split the sunlight with a glass prism into its different constituent colours and this time made the next important step, using a thermometer as a detector he measured the temperature of each colour.


Herschel observed an increase as he moved the thermometer from the violet to the red part of the spectral 'rainbow'.


The result is due to the fact that the blue wavelengths in the classic Herschel experiment are more strongly scattered, hence more "spread out", than the redder wavelengths and thus more energy reaches the thermometers measuring the red end of the spectrum.

This experiment, given the limits of technology at the time, could not measure the discrete energy in each color individually but at the very least Herschel provided a kind of reference frame between different regions of the spectrum, with respect to their indices of refraction by the prism, and their temperatures.

Today, we can measure the discrete energies of wavelengths of light, independent of the effects of light scattering affecting the intensity. As a rule of thumb  thinking in modern terms, blue light is in fact more energetic than red light in terms of the excitation energy of electrons than it is in terms of its "temperature" as measured by Herschel.


Herschel also measured temperatures in the region just beyond the red color where no light was visible as a control. Herschel expected it to merely measure the ambient temperature of the room and, to his surprise, it recorded an even higher temperature there in apparent "shade". He deduced the presence of invisible 'calorific' rays, now called 'infrared' radiation.

An underlying understanding of the physics involved makes a big difference in how to interpret the results. The concept of heat had clearly been known since prehistory, as well as the fact that it travels through the air from a flame or heated object. What Herschel discovered was subtler than the existence of an invisible heat radiation.  Herschel found the first solid evidence that light and infrared are the same quantity that we know today to be electromagnetic radiation, a critical example of scientific reductionism.

Through a series of simple experiments, Herschel found the first piece in one of the great puzzles of physics that would take another century and the formulation of the quantum theory to solve, particularly when one considers that objects that emit light through heating must emit energy in discrete packets, quanta, in order for the visible world to make sense, as is the case for Max Planck's theory of radiation solving some of the absurdities from the so-called "ultraviolet catastrophe".

The Planck Black Body Radiation Curve


But perhaps the greatest lesson to be learned about the discovery of the infrared part of the spectrum of light is how it was discovered. Let us remember: it was not by complete accident. Herschel was thinking about the problem and searching for it the right way, based on an exploitation of the known principles of light, some of which he discovered (i.e. light filtered Red being hotter than Blue). However the discovery was found by a detector system that was not so fine-tuned and was exploring part of the answer in what would appear, on first glance, to be not in a local optimum location but then turned out to be the global optimum of the search for a discovery!

What does it really mean then when we can detect something that is a genuine discovery, using a detector system that is not set up properly? Does that mean that although we may set out to find something to prove (or should I say disprove!) a theory, even if we set up our equipment 100% correct (with that careful precision physicists are most famous for) we may not be guaranteed to find anything because what we are looking for is, in a sense, just a little nudge to the right or to the left?

In the history of science Herschel's discovery of IR radiation is in great company, with the discovery of the CMB as another similar example. I cannot say for all cases but it is sometimes the case and the unfocused or just downright wrong setup can give us real jewels of scientific knowledge.


Extra Points:


*#1
This is particularly evident with Newton's third law. Newton in his time never could explain the origins of forces that governed the laws he discovered, nor could Huygens . Without specifying the nature or origin of the forces on the two masses, Newton's 3rd law assumed they arise from the two masses themselves, that they must be equal in magnitude but opposite in direction so that no net force arises from purely internal forces. Hence physics is then reduced to a kind of balancing act between the 2 opposing masses.

Newton's Third Law is in reality, a meta-law (that is a higher level law invoking the existence of a more fundamental law) and we find, through Noether's Theorem, that it arises as a direct consequence of conservation of momentum, which essentially says that in an isolated system with no net force on it, momentum doesn't change. This means that if you change the momentum of one object, then another object's momentum must change in the opposite direction to preserve the total momentum. Forces cause changes in momentum, so every force must have an opposite reaction force.

But now we may ask:
Why is momentum conserved?
Conservation of momentum comes from an idea called Noether's Theorem, which states that conservation laws in general are a direct result of the symmetries of physical systems. In particular, conservation of momentum comes from translation symmetry. This means that the behavior of a system doesn't change if you select a new origin for your coordinates (put differently, the system's behavior depends only on the positions of its components relative to each other). This symmetry is found in all isolated systems with no net force on them because it is effectively a symmetry of space itself. Translation symmetry of a system is a consequence of homogeneity of space, which means that space is "the same everywhere" - the length of a rod doesn't change if you put it in a different place.
But now we may ask:
Why is space homogeneous?
In classical mechanics, this is one of the basic assumptions that allows us to do anything In this case it basically says that because the laws of physics as expressed in terms of Cartesian coordinates are the same no matter where you put the origin (the coordinate system and its origin is an arbitrary artificial invention) . Noether's theorem mathematically implies that momentum must be conserved in such a condition. 
In reality, according to General Relativity, space actually isn't homogeneous - it curves in the presence of massive objects. But usually it's close enough to homogeneous that classical mechanics works well (gravity is pretty spectacularly weak, after all), and so the assumption of homogeneity holds.


*#2 
In the contemporary world of Newton, the forces of magnetism and static electricity (through rubbing fur on amber and so forth) was known about, albeit nascent by the ancient Greeks and the Chinese too. This knowledge was pure empiricism and with very little theory behind it, and this could have been interpreted as an example of "action at a distance" in which some force overcomes the balance of Newton's third law with regards to the quantity of mass alone. Newton did not have a knowledge of charge or magnetic field strength, and nor would anyone until well into the 19th century.  

It seems that Newton did not pay much attention in incorporating the concept of magnetism or charge in his description of the physical world. He explicitly mentions electricity in Optics and he seems to have used magnets in experimental studies. That he didn't go very far with this is not particularly surprising: forces between permanent magnets do require knowledge of how calculus works in predicting the aspects of electric and magnetic fields and Newton's Laws generally follow afterward. The concept of opposing magnetic poles and electrical charges was not well quantified in Newton's time and so would have appeared somewhat occult to him.

Nevertheless, In the famous final paragraph of the Scholium Generale that Newton added to the second edition of the Principia, published in 1713, he wrote of “a certain most subtle spirit which pervades and lies hid in all gross bodies.” It was this active spirit that gave rise, he supposed, to the electrical attractions and repulsions that manifested themselves at sensible distances from most bodies after they had been rubbed, as well as to the cohesion of particles when contiguous. In addition, he surmised, it was the agency responsible for the emission, reflection, refraction, inflection and heating effects of light; and by its vibrations in “the solid filaments of the nerves,” it carried sensations to the brain, and commands of the will from the brain to the muscles in order to bring about bodily motion.