Saturday 3 October 2020

Image + Video Segmentation in Near-Infrared Using HSV Color Spaces with OpenCV in Python


Here I will be sharing a technique to perform a simple kind of image segmentation used to separate certain objects visible in the near-infrared and ultraviolet using the hue, saturation and value values (HSV) contained in the color space with OpenCV in Python. This is a useful tool in the processing of NIR images and video when we want to search for vegetation in an image using a defined threshold. Moreover, we can perform fast NDVI analysis on the examined region in the video clips. 

First of all we need to set up an idea of what we mean by segmentation. In this case it means to literally cut out an object that has a particular well defined colour in the image taken.

We should remember what we mean by colour itself in an image our brain, or a computer, "sees".

In a very real sense, we see with our mind's own programming, not with our eyes which merely sense changes in sensitivity across sensing elements, the cones in our eyes. For example consider sunlight shining on this apple


What is important to remember is that we do not see the red spectrum of light, but we see every other spectrum except that one! Every color except red is absorbed by the object, our eye sees this and sends a message to our brain. Our brain then labels this this as a red apple. 

This is a labeling procedure that our brains have developed with a dependence on the level of light exposed, not the intrinsic colour of the object. The best example of this dependent effect of light on color is seen when a colored lamp is put on something. If we had a red lamp and turned it on in a dark area, everything would appear to be red... that's because there's only red light to bounce off of it!


These special red street lamps were designed to stop harmful light pollution that can confuse and disturb the health and balance of nocturnal animals, such as bats, insects and even reptiles such as lizards and sea turtles. As we can see ourselves, otherwise green plant and black road appear red even though they would not appear red when radiated in balanced proportions of red green and blue light.


This principle is also true when we take photographs using a CCD sensor, which is equipped with a filter as to properly correlate with our own sense of vision, with some adjustments to sensitivity to light exposure, aperture size and shutter speed.

When the light of a scene enters the camera lens, it gets dispersed over the surface of the camera’s CCD sensor, a circuit containing millions of individual light detecting semiconductor photodiode sensors. Each photodiode measures the strength of the light striking it in Si unit called “lumens.” Each receptor on this sensor records its light value as a color pixel using a specific filter pattern, most commonly the Bayer filter.

A real image being focused and projected onto a CCD image sensor containing a colour filter. The Bayer Filter uses color filters and direct the individual colors red, green, blue onto individual pixels on the sensor, usually in an RGGB arrangement (i.e. 2X2 [RG;GB] ).

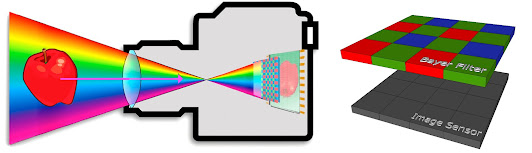
The camera’s image processor reads the color and intensity of the light striking each photoreceptor and maps each image from those initial values in a function called an input device transform (IDT) for the digital sensor information to be used to store a reasonable facsimile of the original scene in the form of raw data containing the color channels in separate channels for processing and colour processing. 

To display the image the raw data must be processed to have a color scale and luminance range to try and reproduce the color and light from the original scene. A display rendering transform (DRT) provides this mapping and are typically implemented in a form of preset ranges which are obtained using calibration standards, such as the SDR and HDR standards. Often raw data must be modified by standalone image processing software with the editor in command of controlling aspects such as contrast, gamma correction, histogram correction and so forth between the separate colour channels before we are given the final satisfactory image

With the RAW image data a process known as Demosaicing (which is also called de-Bayering in our case) is used to reconstruct a full color image, with RGB values at every pixel, from the incomplete color samples output from an image sensor overlaid with a color filter array (CFA).


When this bitmap of pixels gets viewed from a distance, the eye perceives the composite as a digital image. 

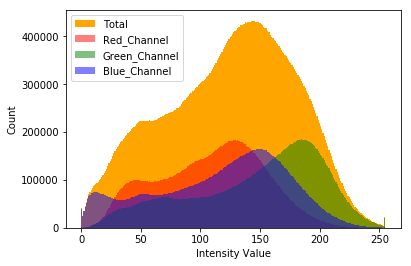
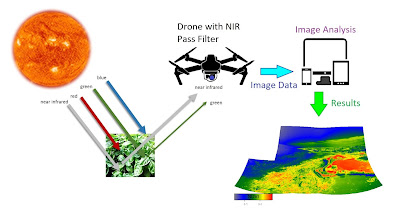
As discussed previously on this blog and showcased on my YouTube videos, I have been imaging individual plants and sections of vegetation in the near-infrared using drones for some time now. As I have shown, the plant material reflects very vibrantly in the near-infrared in the color channel which we associate with the colour red. Therefore if I want to segment the image to separate the plants from the background, using an infrared image, I can set the segmentation around the red color channel.

The individual color channels in an image, red, green and blue, can together form a group which we call a color space. In OpenCV in Python the color space is a tuple, a vector like object in the programming language. A color is then defined as a tuple of three components. Each component can take a value between 0 and 255, where the tuple (0, 0, 0) represents black and (255, 255, 255) represents white.

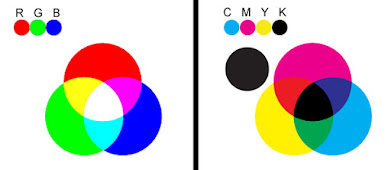
RGB (Red, Green and Blue) colour space is used normally to create colors that you see on television screens, computer screens, scanners and digital cameras.  RGB is often referred to as an 'additive colorspace.’ In other words, the more light there is on a screen means the brighter the image.

CMYK (Cyan, Magenta, Yellow and Black) is known as the 4-color process colors for printing. CMYK is considered a subtractive colorspace. May colour printers print with Cyan, Magenta, Yellow and Black (CMYK) ink, instead of RGB. It also produces a different color range. When printing on a 4-color printer, RGB files must be converted into CMYK color.

The RGB additive colour space vs the CMYK Subtractive Colour Space. As you may notice, there are certain RGB colors you see on your computer screen (or camera) that are unable to be duplicated with basic CMYK. Also notice that CMYK Colour can appear somewhat deeper than RGB combinations. This is part of the reason they are favored in printing.

The HSV (Hue, Saturation, Value) model, also called HSB (Hue, Saturation, Brightness), defines a color space in terms of three constituent components:

Hue, the color type (such as red, blue, or yellow): Ranges from 0-360 (but normalized to 0-100% in some applications)

Saturation, the "vibrancy" of the color: Ranges from 0-100%

Value, the brightness of the color: Ranges from 0-100%

Also sometimes called the "purity" by analogy to the colorimetric quantities excitation purity and colorimeric purity

The lower the saturation of a color, the more "grayness" is present and the more faded the color will appear, thus useful to define desaturation as the qualitative inverse of saturation

The HSV model was created in 1978 by Alvy Ray Smith. It is a nonlinear transformation of the RGB color space, and may be used in color progressions.

In HSV space, the red to orange color of plants in NIR are much more localized and visually separable.

Raw image of the HSV color space, stereographic projection of the surface on a circle

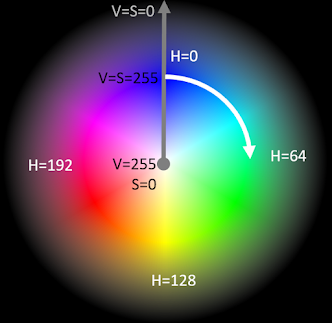
The HSV model is commonly used in computer graphics applications. In various application contexts, a user must choose a color to be applied to a particular graphical element. When used in this way, the HSV color wheel is often used. In it, the hue is represented by a circular region; a separate triangular region may be used to represent saturation and value. Typically, the vertical axis of the triangle indicates saturation, while the horizontal axis corresponds to value. In this way, a color can be chosen by first picking the hue from the circular region, then selecting the desired saturation and value from the triangular region.


Graphics artists sometimes prefer to use the HSV color model over alternative models such as RGB or CMYK, because of its similarities to the way humans tend to perceive color. RGB and CMYK are additive and subtractive models, respectively, defining color in terms of the combination of primaries, whereas HSV encapsulates information about a color in terms that are more familiar to humans: What color is it? How vibrant is it? How light or dark is it? The HSL color space is similar and arguably even better than HSV in this respect.

The HSV tristimulus space does not technically support a one-to-one mapping to physical power spectra as measured in radiometry. Thus it is not generally advisable to try to make direct comparisons between HSV coordinates and physical light properties such as wavelength or amplitude. However, if physical intuitions are indispensable, it is possible to translate HSV coordinates into pseudo-physical properties using the psychophysical terminology of colorimetry as follows:

Hue specifies the dominant wavelength of the color, except in the range between red and indigo (somewhere between 240 and 360 degrees) where the Hue denotes a position along the line of pure purples

If the hue perception were recreated, actually using a monochromatic, pure spectral color at the dominant wavelength, the desaturation would be roughly analogous to an applied frequency spread around the dominant wavelength or alternatively the amount of equal-power (i.e. white) light added to the pure spectral color.

The value is roughly analogous to the total power of the spectrum, or the maximum amplitude of the light waveform. However, it should be obvious from the equations below that value is actually closer to the power of the greatest spectral component (the statistical mode, not the cumulative power across the distribution.)

The saturation and value of the oranges do vary, but they are mostly located within a small range along the hue axis.This is the key point that can be leveraged for segmentation.

Segmentation of true color images in HSV color space can be applied to Near-Infrared photography in the imaging of the near-infrared reflectance of plants. 


By applying a threshold in the interpreted red band we can separate the vegetation, taken in the NIR, from the background. 

#threshold vegetation using the red to orange colors of the vegetation in the NIR

low_red = np.array([160, 105, 84])

high_red = np.array([179, 255, 255])


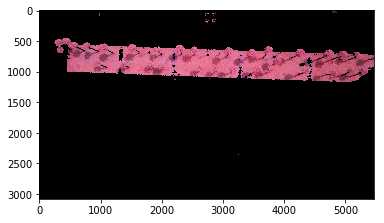
This is a fairly rough but effective segmentation of the Vegetation, in NIR, in HSV color space.

Going further we can process the selected region to form an NDVI in the region of interest. consider the NDVI taken broadly over the entire image:


Processing this image takes time, especially in RAW format, and in areas where there is more concrete and rock than vegetation much of the processing seems redundant as we usually do not care about NDVI scaling of rock.

Processing NDVI in the threshold region of interest meanwhile saves a lot of processing time and creates a more precise examination of NDVI with respect to the color key:


Here we see a video showcasing image segmentation for NDVI image processing using OpenCV in Python applied on Near-Infrared drone images and video.


This procedure is very useful for accurate scaling of NDVI in the region of interest, the vegetation of the image, and removing the background so as to focus on the NDVI of plant material only. The potential for detecting plants in an image or video is also a field of interest for us in plant exploration and detection in desert regions and for plant counting by techniques such as ring detection. It is hoped these developments will be useful in detecting rare or well hidden plant specimens in remote areas for plant population monitoring in deserts and mountains.


Notes:

OpenCV by default reads images in BGR format, so you’ll notice that it looks like the blue and red channels have been mixed up. You can use the cvtColor(image, flag) and the flag we looked at above to fix this:


Python Source Codes available on the following GitHub repository:

Coding available here: https://github.com/MuonRay/Image-Vide...


Monday 14 September 2020

New Developments in Multi-Spectral Drone Imaging in the Ultraviolet Band


Here, I report a brand new filter-based modification of a 4K Camera, The Hasselblad 20MP Camera onboard the DJI Mavic 2 Pro, to develop an ultraviolet (UV) imaging system for remote sensing.

This was achieved via testing and adapting new quartz-based Ultraviolet imaging filters as well as thin film solar-filters in conjunction with commercial cameras modified using "hot-mirror" filter removal.

The Hasselblad cameras used in the Mavic 2 Pro contain one of the best passive imaging,
complementary metal-oxide semiconductor (CMOS) sensor, A 1-inch sensor with 20 megapixels which can be set to image using very high exposure to record in the Near-UV.

The utility of these devices is demonstrable for applications at wavelengths as low as 310 nm,
in particular for sensing vegetation in this spectral region. For this a novel UV-based remote sensing
classification index has been developed for use in experimental Ultraviolet aerial imaging using
drones.

Given the relatively very low cost of these units as compared with other cameras in this field of imaging, and  the fact they are integrated on a superb platform for deployment, a semi-autonomous aerial vehicle, they are suitable for widespread proliferation in the field of environmental monitoring
in a variety of UV imaging applications, e.g., in atmospheric science, vulcanology, oceanography, forensics, monitoring of industry and utility structures (in particular powerlines and smokestacks), fluorescent tracer measurements and general surface measurements.

I am beginning experimental testing of this technology in Gran Canaria over the next few months. I have already begun to construct test image datasets for analysis using a prototype Normalized UV Absorption Index (NUVAI)

With this index I hope to be able to classify vegetation and surface features based on their UV absorption characteristics and compare with the NDVI taken using the same camera with my already extensively tested Infrared Filters.


Ultraviolet Drone Aerial Image


Using Python coding I have digitally processed some of the test images already and hope to perform similar work as used in my near-infrared (NIR) drone research. 
Ultraviolet Reflectance with an NDVI-style Key

All coding available through my GitHub Repository - https://github.com/MuonRay/Ultraviolet_Image_Python_Processing_Codes


Monday 7 September 2020

Ion Propulsion of Magnetic Levitating Graphene E-Sail: "Tesla-Kinesis"


In this short experimental demonstration, I share a concept of induced ion propulsion using positive ions that create a wind that can push a thin-film of graphene that is kept levitating at effectively zero-G using a rare-earth magnetic track. This is, in effect, an ion "E-sail" (electric sail) that can capture the momentum of the ions emitted and transfer them into motion in the direction of the ion flow.


The ion source is a modified Tesla coil, a high voltage source, that causes breakdown of air above a sharp steel tip creating a streak of positive ions that move away from the source in a direction toward the sample being probed and propelled.


This system is a simulation of the solar-wind that is whipped up by the high temperatures and magnetic activity of the stars themselves. The Sun produces a significant solar wind, made up of protons and helium nuclei, which are emitted at high velocities from the solar atmosphere, the corona, and solar surface during solar flares and coronal mass ejections. The energy that is emitted in these eruptions, translated into the stream of high velocity charged ions, is perhaps the greatest free source of space propulsion and could, potentially, carry spacecraft equipped with massive solar sails to the outer reaches of the solar system at speeds that would be impossible to achieve using chemical propulsion or gravity assists and without the need for onboard propellant.


Indeed, interstellar space travel could be achieved using this effect over the more energy intensive photon-assisted propulsion which is also another interesting avenue of research which could utilize the high durability and strength of graphene material. Graphene also has the advantage of being highly resistant to radiation and the electrical current induced by ion capture may itself be used as an energy source for the spacecraft with a large enough sail. In any case the effect itself is interesting and demonstrates, if nothing else, the principle of converting electrical energy into kinetic energy and the visual demonstrations of the concept of an ion wind.


Wednesday 26 August 2020

Hybrid Wearable Energy Harvester -Thermal and Solar Energy Harvesting


Thank you for your support for this and other projects on my channel: https://www.patreon.com/muonray

I have been working on this flexible wearable hybrid energy harvester prototype for some time as a follow up to a previous version that used a new flexible thermoelectric material that allows one to convert body-heat to electricity in a wearable design, as shown here: 


Here I present to you a new technology showcase with a lot of potential over the next few years - wearable and flexible hybrid energy harvesters that can acquire multiple energy sources simultaneously and convert them into useful electrical energy for charging and lighting applications. The possibilities are large with this kind of electronics and I have no doubt that companies will begin to develop wearable appliances similar to this over the next few years especially as new generations of energy efficient smartphones, watches and even clothing integrated electronics become more widespread.

The South-Korean Company TegWay have developed flexible Peltier-effect thermoelectric heater/cooler (TEC) modules for use in augmented and immersive virtual reality applications - giving game controllers the ability to create feelings of cold or heat for immersive movie or gaming experiences for example. The same technology can also be used to create TEG modules for use in energy harvesting applications.

This kind of flexible energy harvester kind of a silver bullet for energy harvesting from body heat and also from waste heat from pipes and circular objects such as pipes which would have been difficult to attach a monolithic rigid TEG module and efficiently power devices from, such as IOT sensors and such, and to conserve energy loss in general from a system. In effect there is never such a thing as "free" energy, the waste heat being converted to electricity has its origins in either metabolic processes from a human being in wearable energy harvesting or as waste heat from a machine or power source.


It may be possible to see flexible thermoelectric generator modules stitched into clothing in the near future for powering smart devices such as phones and watches. More interesting applications still involve the development of thermoelectric energy generator (TEG) suits for expeditions in remote places to power electronics for geotagging or monitoring sensors. 

Perhaps such TEG Suits could be put to use out in the blustery conditions at sea, in mountains and the cold polar regions of the Earth or even developed into spacesuits for generating on-demand electricity for astronauts exploring Mars!


One can think of an suit that harvests Energy in cold environments being a huge advantage in places such as Antarctica or in the frigid conditions of the planet Mars where the temperature differences between the human body inside the suit and the subzero temperature outside the suit could be used to create a significant amount of power for explorers.

Combining the technology with an efficient flexible thin-film solar panel adds for more energy harvesting capacity and does not significantly affect the heat exchange mechanism as long as the solar cell used is of an extremely thin film. Positioned with the back of the element is Coated with Silver Thermal Paste and combined with Flexible Silicone allows for even more efficient Heat Exchange, creating a temperature differential across the TEG element and allowing the solar energy to be harvested while the element is in contact with a warm body or other heat source, for example electronic equipment that gets warm with use. 


Another application could be in the geotagging of warm-blooded animals using a system that does not depend on batteries recharging from solar panels and instead uses the animals own body heat to power the device


Perhaps such hybrid energy harvested-powder gps tags could find use for maritime applications or in colder regions of the earth, for more see this article here:
https://phys.org/news/2020-07-solar-powered-animal-tracker-animals-wild.html


For the moment research is ongoing in developing applications and this still remains an interesting demonstration to observe the ability to transform one type of energy, thermal energy, into another, electrical energy.


Monday 24 August 2020

MuonRay Enterprises Now Based in The Canary Islands For New Research Opportunities!


I am pleased to announce that starting this week I am now based in Las Palmas in Gran Canaria for an exciting new series of research projects involving the testing of new imaging technologies for use in drones and astronomical optics.

Some of the new projects I am involving myself in include further testing of infrared optics for use in drone cameras and a brand new technique I have been developing that uses Ultraviolet filters to allow for real-time Near-Ultraviolet Drone Filming and Photography.


A Near-UV test photo - The Dry Conditions and high UV radiance of the Canary Islands should allow for excellent filming conditions. 

I am confident that this new technique of imaging will open up a whole new field of environmental imaging in the near-UV that will be an exclusively drone-based imaging technique for remote sensing.


I am also working on new infrared imaging techniques for use in astronomy using cryocooled sensors I have been developing in Ireland for use in astrophysical imaging and filming in the Long-Wavelength Infrared (LWIR) that I have been developing in Ireland for some years now. A video of such a cryocooler I will be using with a LWIR CCD sensor is shown below:


Thank you very much for all the supporters of these projects in the past and the future is looking very bright indeed for research for the next couple of months and hopefully beyond here in Gran Canaria!


Monday 22 June 2020

Plotting for Scientific and Engineering Applications Using Python


In learning anything to do with programming it often helps to have a motivating factor to invest time and effort into developing a particular programming application.

I have long found Python to be a very valuable tool with regard to spectrum analysis and image processing in developing remote sensing technology using modified drone cameras equipped with customised filters.

The science of acquiring images which contain information, such as near-infrared imagery, involves the development and testing of specialised optical filter technology for use in modified cameras for imaging.

The 2 filters developed for this purpose are essentially dual bandpass filters, made of high quality glass, with different transmission characteristics in the near-UV to blue band and Near-infrared band.

They are circular filters embedded in a custom housing for use with the Mavic 2 Pro Hasselblad Camera.

Filter#1


Filter#2


Measuring the spectra of the optical filters is critical for defining their application in the field.

We can measure the characteristic spectra using a visible wavelength optical spectrum analyser (OSA) and read the data into a plot in Python showing the dual-bandpass nature of the filter at 2 critical wavelength regions. 


We can overlay 2 sets of data from 2 filters and compare the 2 in the same wavelength regions


Both Types of Filters for sale here:

https://www.ebay.ie/itm/155859816325

https://www.ebay.ie/itm/155859834544


We can also study the color histogram of the image taken by comparing an image taken without a filter and and image taken using the different filter types.

With No Filter:


With Filter #2:


This information is useful in constructing radiation indices for identification of quantifiable objects in an image, which is key in the practice of quantity surveying using remote sensing techniques.

As we can see using the filter the green channel is greatly diminished and we can leverage the amount of Red detected (which is NIR using our filter) with the Blue using our formula to get the modified NDVI, giving a way to quantify the vegetation density in a photographed and/or mapped region. 


We can also plot the Red channel (Our NIR) vs the Blue Channel (Our Visible Leverage) to get a characteristic soil and wet edge profile, a kind of correlogram, which is very useful as a remote classification tool. 


The data in the scatter plot has a particular pattern however it is really too dense to properly interpret. A solution to this is to create a hexagon bin plot. 


we can tidy up our plotting further by using the gaussian kernal density function. This also helps prepare the plot for further study as we shall see.

To begin we need to flatten the data from a 2D pixel array to 1D with length corresponding to elements (Warning! this can take some time). the fastest way to do this is to use the python library-level function ravel, which reshapes the array and returns its view. Ravel will often be many times faster than the similar function flatten as no computer memory needs to be copied and the original array is not affected. *

With added shading we get an easier graph to view and work with overall:


With the ability to place a contour around certain regions of the plot we can then have the ability to link the spectral content with the spacial content in our image analysis.

First we can define a threshold for our NDVI and plot it to see the NDVI levels marked above this threshold if we wish


Next we can place a contour over the spectral region that the threshold mark corresponds to in the NIR vs Blue spectral graph.


We can interpret this ourselves and classify the spectral analysis using established knowledge of its features. This is the beginning of developing a kind of classification system based on this linked information.

We can also classify using other means such as plotting the pixels located between the dry and wet wedges to indicated where mixed vegetation could be.

Going futher down this path leads to exploring other tools such as clustering algorithms, support vector machines, neural networks and the like as we approach the cusp of the field of machine learning with our spectral information which is a valuable technology in and of itself. This deserves its own series of articles with regard to combining drone-based  remote sensing with machine vision tools, particularly some of those features in use in the QGIS toolboxes, such as Orfeo.

Interesting still is the fact that indices beyond the NDVI can be developed and studied using these scientific plotting techniques using new filter designs to explore new potential environmental markers. An Ultraviolet-based environmental index using UV-remote sensing cameras is already under development for use in land and marine applications, taking advantage of the ability of UV light to penetrate the air-water barrier and return useful reflectance image information which we will be exploring in the near future. 


As always the code is available on the GitHub page and is open for customisation and tinkering for each persons own needs: https://github.com/MuonRay/PythonScientificPlotting


Notes:

* see reference to this at pages 42-43 @ Numerical Python: A Practical Techniques Approach for Industry By Robert Johansson

Saturday 13 June 2020

Drone NDVI Mapping with QGIS and Python Analysis Code


Code Link: https://github.com/MuonRay/QGISPython/blob/master/NDVIQGISWithMapLegend.py

In this video I showcase the creation and use of Near-Infrared (NIR) TIF orthomosaic datasets made using UAV (drone) photography and photogrammetry which can be analysed in QGIS using a Normalised Differential Vegetation Index (NDVI) processing in the Python console in QGIS. This is comparable to the analysis done using satellite imagery, such as Sentinel-2, however using a 4K NIR converted camera on a drone flying at a maximum height of 70 meters means that we can get up to 1cm pixel resolution on the ground, allowing for very accurate remote sensing of areas of interest.

QGIS itself a free geomatics software package with a lot of functionality with regards to creating custom code recipes for analysis of datasets acquired using Earth-monitoring satellites and/or drones. There are a lot of interesting add-ons for QGIS, going from simple codes that allow for a cursory editing of a dataset to improve contrast or in more complex applications such as the Orfeo toolbox for machine learning. QGIS, being opensource means that there is large online community of professionals who use its features in research and industry alike and regularly update the different applications of this impressive piece of software.

Scripts that run in QGIS are written in Python code with a particular syntax native to QGIS that allows it to call its image processing libraries, which work on TIFs with greater ease than Python standalone scripts alone would and do not create lossy conversions as experienced with Python standalone coding libraries when processing TIF data. There is also options to save the processed images with a defined dpi ratio to preserve the image quality when saving to PNG or JPEG files for viewing completed maps outside of the program.

I would highly recommend using QGIS in conjunction with drone imaging and I am eager to explore some of the more in-depth of its applications further, in particular with respect to the classification and potential of the Orfeo machine learning toolbox.

Tuesday 9 June 2020

Fusing 3D Modelling with NDVI in Python + VisualSFM + Meshlab


Here is an exercise in 3D image processing I performed using Near-infrared images processed into colormap NDVI, allowing me to create a 3D model of plants for use in 3D plant monitoring/health classification.

Near-infrared (NIR) reflectance images as described before can carry information about the health of plants, with healthy plant tissue reflecting more strongly in NIR as well as Green.


The NDVI formula leverages the NIR channel with the visibly reflected light, in an NIR converted camera the Red channel becomes NIR and Blue and Green become the visible. The dual-bandpass filter chosen will separate the different color channels, in the case of the filter I use a separation between the blue and NIR regions of the spectrum.Thus In my Python code used to generate the NDVI, the blue channel is leveraged against NIR for more precise close range NDVI.


This was created using (1) custom Python code to process the NIR reflectance images into a graded NDVI temperature scale images and using a combination of (2) VisualSFM for point cloud and polygon generation and (3) Meshlab to tidy up and display the polygon file.


An RGB reconstruction was also performed on a collection of standard images (captured using a phone camera) of the collection of plants scanned for comparison.

The NDVI 3D model was not a perfect reconstruction however it was cleaner in general than the RGB model and considerably faster to process in VisualSFM after the Python code had processed the input RAW (DNG format) images. It is relatively easy to see the distinction between the healthy vegetation and the background environment, the wooden decking, the plants were placed upon in the NDVI 3D model. This has lead me to think that this technique could be further developed in machine vision of plants in an environment in 3D, especially if the 3D model can be converted into a movie using a program like CMPMVS which could then be plugged into a platform such as PyTorch or Tensorflow for use in plant health classification in 3D.In any case this was an interesting way to demonstrate the use of NDVI and NIR imaging as applied in novel applications in the field of 3D photogrammetry and modelling with the intent of creating datasets for future explorations in machine vision research.Code Available Here: https://github.com/MuonRay/PythonNDVI/blob/master/ndvibatch.py


Wednesday 27 May 2020

Generating NDVI Drone Panoramas in Python Code


 I share the development of a project that uses near infrared drone imaging to create NDVI panorama mosaics in Python with all coding available on the GitHub Repository here:
https://github.com/MuonRay/PythonNDVI/blob/master/PanoramaNDVIRawInput.py

Panorama Stitching, as used in aerial/satellite imaging and space exploration, uses a point matching algorithm (i.e. SIFT) on images taken from a camera then applies a homography transform creating a mosaic composite image. 

Here Using a 4K NIR Drone Camera we can create HDR NDVI Panoramas using DNG files for input (a JPEG Version is also available).  


We have talked about NDVI and how to generate standalone NDVI Drone images in previous articles such as here: http://muonray.blogspot.com/2019/07/ndvi-vegetation-mapping-project-with.html and here: http://muonray.blogspot.com/2019/10/specialist-ndvi-filter-developments-for.html

DNG is the RAW Format used in DJI's Mavic 2 Pro drone and is a data rich file format that requires Python's rawpy library to decode into a form that can be worked with using OpenCV for general image editing generally and panorama stitching specifically in Python.

It is hoped that this coding project will be a less computing intense solution to generating NDVI diagnostics of the environment without the need for expensive or computationally intensive processing such as creating 3D orthomosaics or photogrammetry files which can be relatively more daunting to produce and work with as compared to a panorama. 


Essentially any images acquired using a Near-Infrared (NIR) converted camera can be used to generate a modified Normalized Differential Vegetation Index (NDVI). The coding contains standalone colorbar legend and is a batch processing version that works with all DNG files in the working directory. ENDVI and SAVI Indexes also available and with greyscale options. in the larger Python NDVI GitHub project folder. I also encourage open modification and tinkering of this projects code for improving this field of exploration and environmental examination.


I have also included a selection of custom developed python codes for use in various drone imaging applications, such as batch conversion of DNG (RAW) drone images to JPEG or PNG, use of the rawpy library features of demosaicing, gamma factor correction and use of skimage library to demonstrate histogram equalization in colour images to create better contrast and depth. This repository also increases coding developed for use in generating panorama composite images both in JPG and DNG format, a very useful technique in high definition aerial imagery. These codes are open for use in educational and demonstration uses and for non-profit organisations.

See here:https://github.com/MuonRay/Drone-Image-Editing-in-Python-Coding-Repository

Wednesday 29 April 2020

Using Adobe Bridge with Camera Raw for Drone Panorama Editing Applications


Here is a short video showing how I use Camera Raw in Adobe Bridge to generate Drone Panorama images quickly and easily with or without opening Photoshop. The advantages processing in Adobe Bridge offers is that it can improve the speed and efficiency of stitching together large images in panorama without slowing down your computer significantly.

Photoshop, like all programs, uses up some of your computer's resources while it's open. Even if you're not working in Photoshop at the time, as long as it's open in the background, it's still using up resources. If you're working on a slower computer to begin with, having programs open in the background that you're not using can slow you down even more.

Camera Raw offers such a complete image editing environment that it's entirely possible to do everything you need to do with your photo in Camera Raw without ever needing to open it in Photoshop for further editing, including cropping, aligning, contrast and color channel editing. Camera Raw is perfectly capable of running in Bridge itself, or another way to put it, Camera Raw can be "hosted" by Bridge, just like it can be hosted by Photoshop.

Another benefit to running Camera Raw from Bridge, and one that has an impact on your workflow, is that when you're finished processing one image in Camera Raw and click the Done button to close out of it, you're instantly returned to Bridge, ready to select and open the next image or sets of images for further processing.


Thursday 26 March 2020

Coronavirus Emergency In Ireland - Why The Government Must Mandate a 2 Week Total Shutdown


This is an urgent message, so lets not waste time with introductions.

The Government of Ireland must mandate a Complete Shutdown of all non-essential and non-medical business immediately. 

This means closing all non-essential manufacturing, factories, construction sites, call centers and non-essential warehouse work (excepting medical device, food services for humans and animals, pharmaceuticals and other essentials) - Private and Multinational firms that are still continuing business as usual in Ireland MUST BE CLOSED - They must not be allowed to continue work as they dictate until they chose to close. WE ARE IN A NATIONAL CRISIS AND THEY MUST BE MANDATED TO CLOSE. 

I RECOMMEND THAT AS MANY PEOPLE AS POSSIBLE USE THIS POST AS A PLATFORM TO NAME AND SHAME PRIVATE COMPANIES IN THE REPUBLIC OF IRELAND THAT ARE REFUSING TO CLOSE AND PUTTING THE LIVES OF OUR CITIZENRY AT RISK AND ARE MORTGAGING THE FUTURE OF LIFE AS WE KNOW IT FOR SHORT-TERM PROFIT.

The numbers of people out on the streets, parks, beaches and other public environs is also alarming. In the UK it is now illegal to be out during a nationwide lockdown while in Ireland we have still not made measures to ENFORCE SOCIAL DISTANCING THAT CAN SAVE HUNDREDS IF NOT THOUSANDS OF LIVES. 


Despite many euphemisms and mitigating measures the government has taken they have been half-measures at best and will do nothing to FLATTEN THE INFECTION CURVE. WE MUST MOVE PAST HALF-ASSED MITIGATION AND HAVE A FULL LOCKDOWN, APPLY "THE HAMMER" - Only then can we move onto "THE DANCE" AND CAREFULLY RESTART OUR COUNTRY AGAIN.

The key word here is MITIGATING MEASURES. the government refuse to take any hardline measures to, in-effect, flatted the infection from an exponential rate to a linear rate and eventually reaching a level that will not overwhelm our already beleaguered healthcare system. 


We have healthcare workers who can only be considered superheroes at this point who are quickly becoming so overwhelmed that they are, in-effect, samurai in nurses and doctors clothing. They are risking their own lives and also having to take the extra burden and risk because, again PRIVATE BUSINESSES REFUSE TO CLOSE ON THEIR OWN! THEY MUST BE FORCED RIGHT NOW!

TIME IS KEY IN ALL OF THIS. WE MUST GET OUR COUNTRY FROM AN EXPONENTIAL STAGE OF INFECTION RATE TO A LINEAR STAGE AND FLATTEN THE CURVE. WE CAN ONLY DO THIS WITH A FULL LOCKDOWN FOR AT LEAST 2 WEEKS!

To citizens I recommend you STAY INDOORS AS LONG AS POSSIBLE, we can only fight this virus and stop it becoming a permanent part of the microbial ecosystem in this country if we band together on this and most importantly HOLD BUSINESS AND GOVERNMENT TO ACCOUNT! DON'T FORGET THAT THEY SHOULD HAVE HAD A WUHAN OR RUSSIAN STYLE LOCKDOWN AT LEAST A WEEK AGO IF NOT TWO!

THE DATA DOES NOT LIE - The John's Hopkins Website has been providing more up to date information than any of the highly funded and subsidized quangos and institutions in IRELAND. The most important detail is to read the shape of the graph, not merely quote numbers.

This is Our Status (March 26th 2020):


WE ARE HEADING INTO EXPONENTIAL GROWTH. WE MUST ACT NOW!

Compare this to Italy, the Worst Country Hit in Europe:


EXPONENTIAL INFECTION RATE HAS CAUSED THE VAST NUMBER OF DEATHS WITHIN ITALY.

SEE John's Hopkins COVID 19 Updates live here: reading the curve is far more essential than the individual numbers: https://coronavirus.jhu.edu/map.html

The Ideal is to APPLY THE HAMMER, initiate a 2 week controlled lockdown and flatten the infection rate, as CHINA and most East Asian Countries have done:


WE HAVE BEEN TOLD CONSTANTLY BY THE IRISH GOVERNMENT AND THE MAINSTREAM MEDIA (RTE Are most culpable) THAT THE WORD "LOCKDOWN" IS A SCARE TACTIC. WELL, IN TIMES LIKE THIS FEAR WORKS TO GET THE JOB DONE. WE DON'T HAVE TO BE AFRAID FOREVER BUT THIS CRISIS REQUIRES US TO REALLY BE AFRAID FOR OUR LOVED ONES AND FOR OURSELVES.

Morever, it has not been the word "lockdown" that the citizenry have had a hard time understanding: The term "Social distancing" has been apparently interpreted by the public with a mixture of confusion and reckless abandon, maybe because it was written by the same second-rate advertising gurus that write the script our politicians read. 

As the Comedian George Carlin once said "Euphemisms are bullshit, people need direct honest language" - So, my fellows, please STAY INDOORS FOR AS LONG AS YOU HAVE FOOD AND MEDICINE! 


Again, to the Government, INITIATE A CLOSURE OF NON-ESSENTIAL PRIVATE BUSINESSES TO ENSURE THAT WE FLATTEN THE INFECTION RATE! YOU WILL BE HELD ACCOUNT FOR THIS NEGLIGENCE!

We can hopefully look back on this moment and perhaps laugh and have a kind of "I was there" moment with the kids in the future. Perhaps. But if we do not act now we are going to plunge this country into loss and sorrow that will take generations to heal. Please do what is in the common good.

IMPORTANT NOTE:

As I write this America has overtaken every other country as the most heavily infected. this was not unexpected given the delayed response there however they are due to get much worse due to the high level of exponential growth leading to a great strain on their healthcare system: